The 2018 podcast statistics are now in from the folks at PodcastInsights.com!
We are sharing their awesome Podcast Listeners graphic, as well as their statistics broken down by demographics, where/when/why/how, and behaviors.
Podcast Listeners

Demographics
- 64% of the US population is familiar with the term “podcasting” – up from 60% in 2017 (Infinite Dial 18)
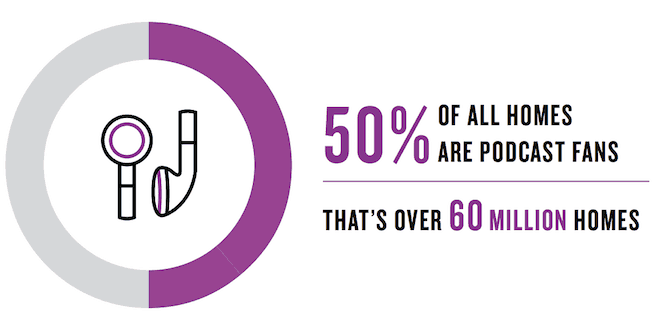
- 50% of all US homes are podcast fans (Nielsen, Aug 2017)
- 44% (124 million) of the US population has listened to a podcast – up from 40% in 2017 (Infinite Dial 18)
- 26% (73 million) listen to podcasts at least every month – up from 24% in 2017 (Infinite Dial 18)
- 17% (48 million) listen to podcasts weekly – up from 15% in 2017
- 16 million people in the US are “avid podcast fans” (Nielsen Q1 2018)
- 56% of podcast listeners are Male
- 45% of monthly podcast listeners have household income over $75K – vs 35% for the total population
- 27% of US podcast listeners have a 4-year college degree – vs 19% for US pop
- 36% of podcast listeners are non-white – vs 30% in 2010 (Nielsen, Aug 2017)
Where, What, When and How
- 49% of podcast listening is done at home, down from 51% in 2017
- 22% listen while driving (in a vehicle), same as 2017
- Podcast listeners subscribe to an average of 6 shows
- Podcast listeners listen to an average of 7 different shows per week, up from 5 in 2017
- 80% listen to all or most of each episode, down from 86% in 2017
- Podcast listening on a computer went up from 29% to 31% (smartphone listening went from 71% to 69% respectively)
- 19% of listeners increase the speed (listen faster)
- 65% of monthly podcast listeners have been listening for less than 3 years
- Comedy is the most popular podcasting genre, followed by education and news
Behavior
- Podcast listeners are much more active on every social media channel (94% are active on at least one – vs 81% for the entire population)
- Podcast listeners are more likely to follow companies and brands on social media
- Podcast listeners are more likely to subscribe to Netflix or Amazon Prime (meaning they are less likely to be exposed to TV advertising)
- Podcast listeners are more likely to own a smart speaker (Amazon Alexa or Google Home)
- 51% of bottled water households are podcast listeners (Nielsen, Q3 2017)
- 57% of baby food households are podcast listeners (Nielsen, Q3 2017)
- 53% of beer households are podcast listeners (Nielsen, Q3 2017)
- 56% of juice households are podcast fans (Nielsen, Q1 2018)
- 54% of milk households are podcast fans (Nielsen, Q1 2018)
- 54% of cereal households are podcast fans (Nielsen, Q1 2018)
- 69% agreed that podcast ads made them aware of new products or services
Click HERE for the original posting on podcastinsights.com